Quickstart
Ravix 1.0.1: a complete workflow in five minutes.
Installation
pip install ravixTo upgrade:
pip install --upgrade ravixImport
import ravixLoad a dataset
df = ravix.get_data("Betas.csv")
df.head()
Unnamed: 0 AAPL CAT ... MSFT XOM SPY
0 2018-09-01 -0.004825 0.098236 ... 0.022079 0.071435 0.001412
1 2018-10-01 -0.030477 -0.204407 ... -0.066101 -0.062809 -0.064891
2 2018-11-01 -0.184045 0.125409 ... 0.038199 -0.002259 0.018549
3 2018-12-01 -0.113616 -0.063389 ... -0.080090 -0.133569 -0.093343
4 2019-01-01 0.055154 0.047927 ... 0.028158 0.074644 0.086373
[5 rows x 9 columns]Tip: Call
ravix.get_data()with no arguments to list all available datasets.
Fit an OLS model
model = ravix.ols("AAPL ~ SPY", df)View the summary
model.summary()Summary of OLS Regression Analysis:
======================================================
Coefficients:
------------------------------------------------------
Estimate Std. Error t-value p-value
Intercept 0.014223 0.011989 1.186 0.2437
SPY 1.2266 0.21591 5.681 2.24e-06 ***
Model Statistics:
------------------------------------------------------
Residual Std. Error: 0.069147
R-squared: 0.4870 AIC: -88.2432
Adj. R-squared: 0.4719 BIC: -85.0761
F-statistic: 32.2745 on 1 and 34 DF, p-value: 2.24e-06
======================================================Scatter plot with fitted line
ravix.plot("AAPL ~ SPY", df)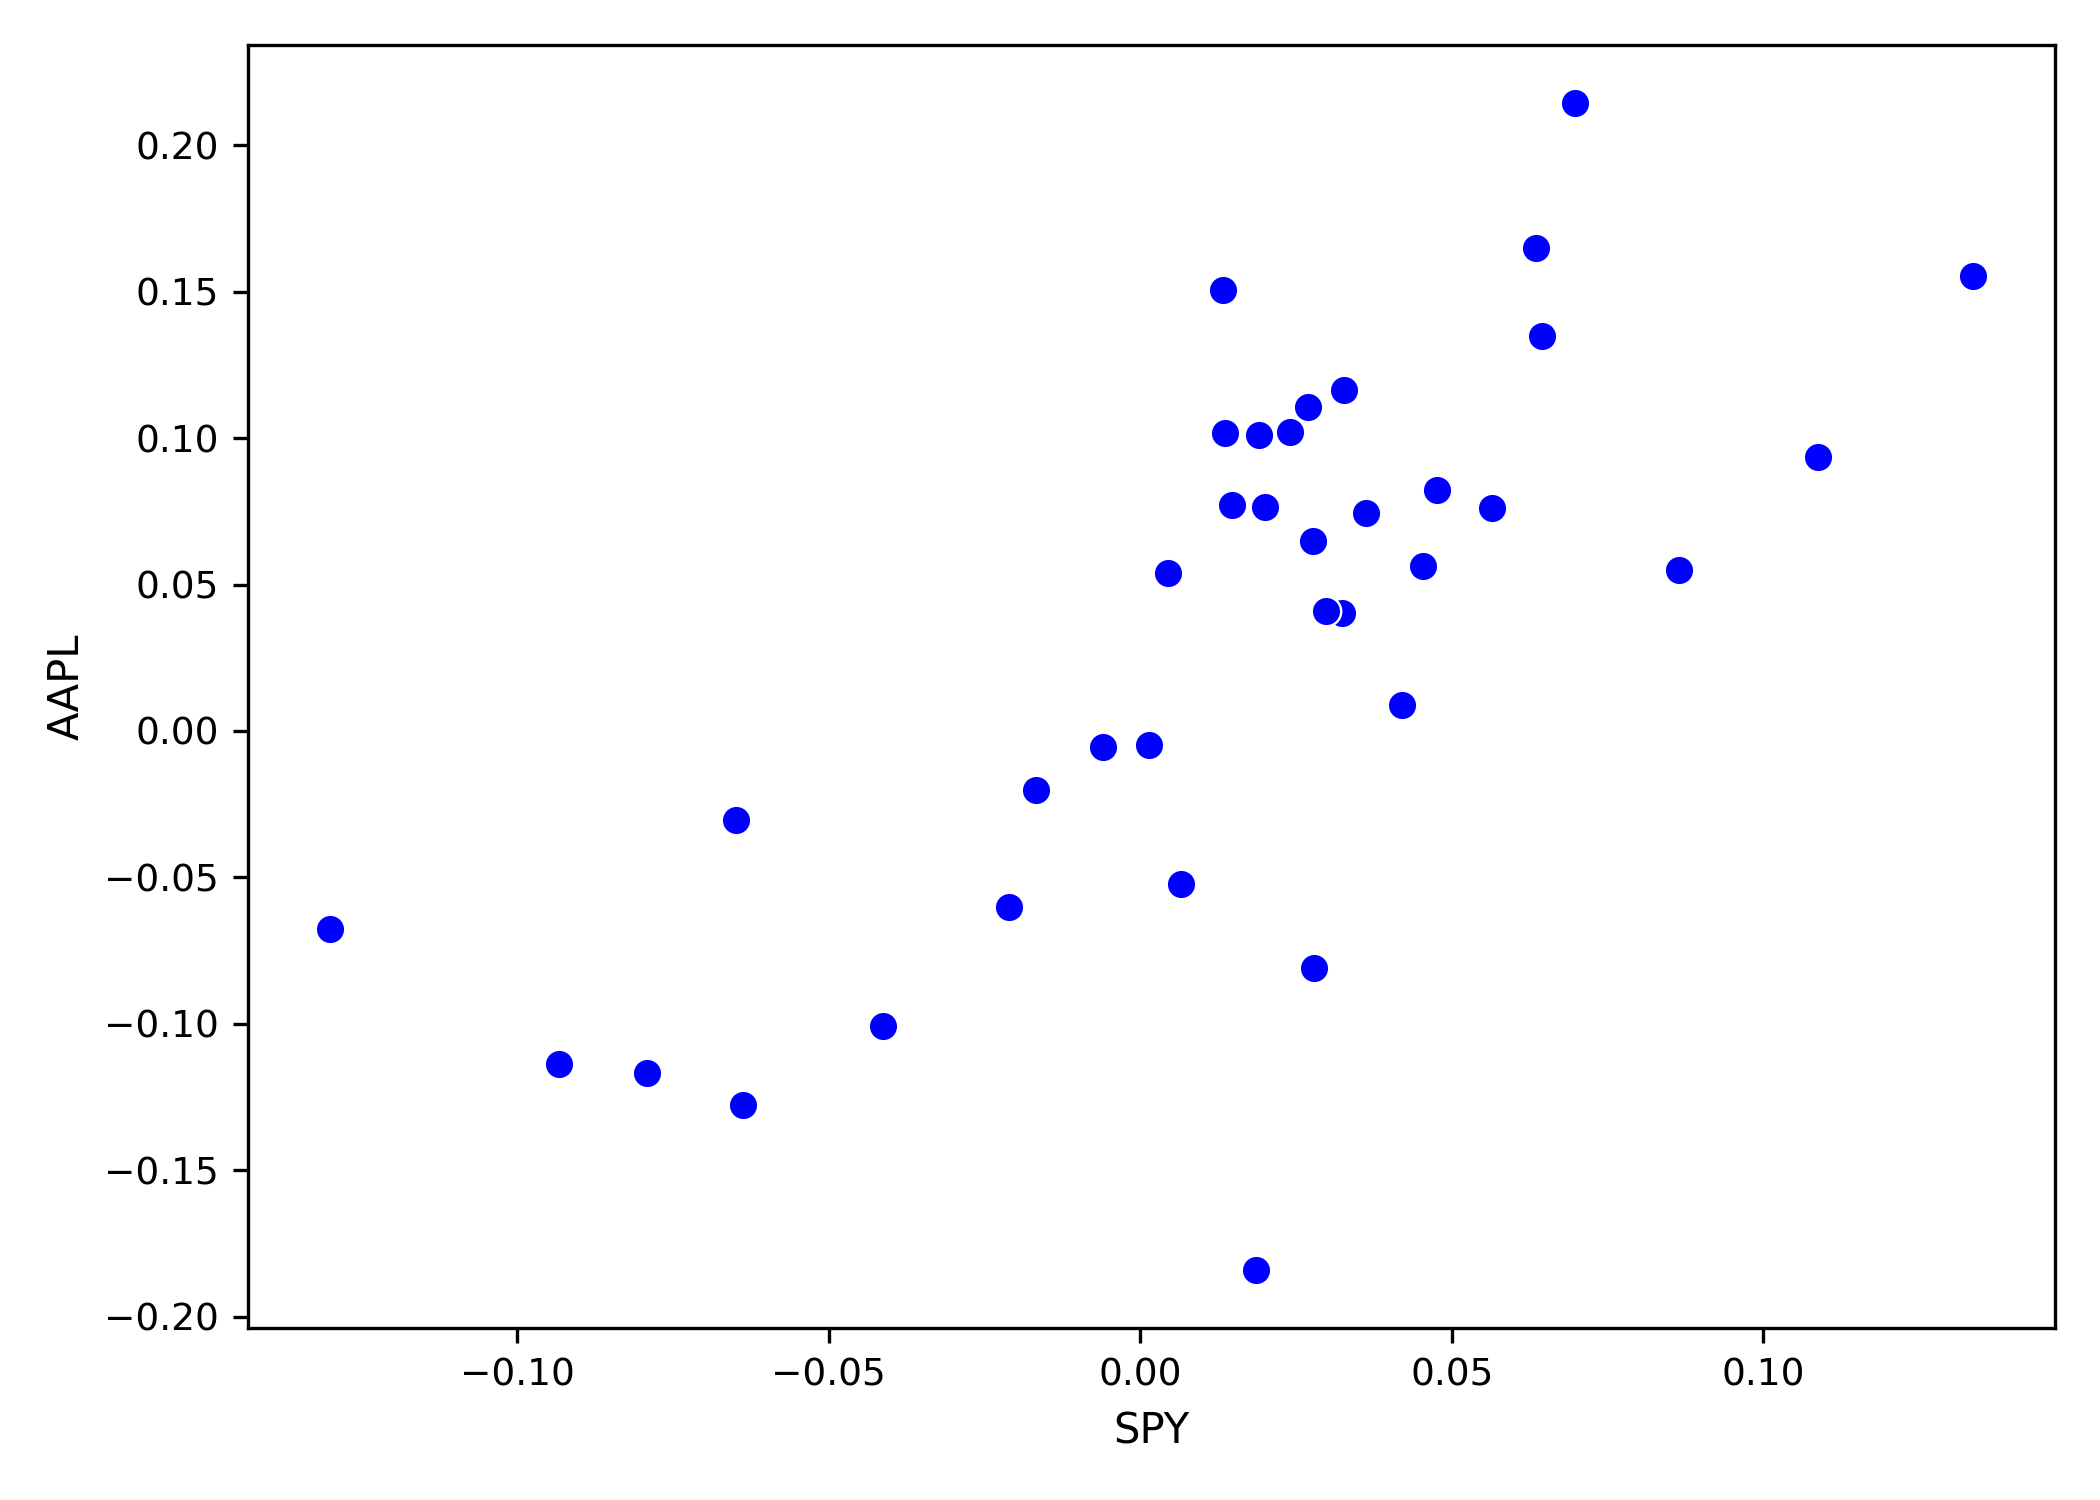
Diagnostics
ravix.bp(model)Breusch-Pagan Test for Heteroscedasticity
=======================================================
Test Statistic : 0.0309
p-value : 0.8604
Result : Homoscedastic (p >= 0.05)
=======================================================ravix.shapiro(model)Shapiro-Wilk Test for Normality
=======================================================
Test Statistic : 0.9465
p-value : 0.0811
Result : Normal (p >= 0.05)
=======================================================Next steps
| Topic | Section |
|---|---|
| Full OLS options | OLS Fitting |
| All diagnostics | Model Diagnostics |
| Variable selection | Model Selection |
| Plotting functions | Visualization |
| Full API | API Reference |